Feature
Rob Smedley explains how the new AWS Braking Performance graphic works, and what it will tell us
Share

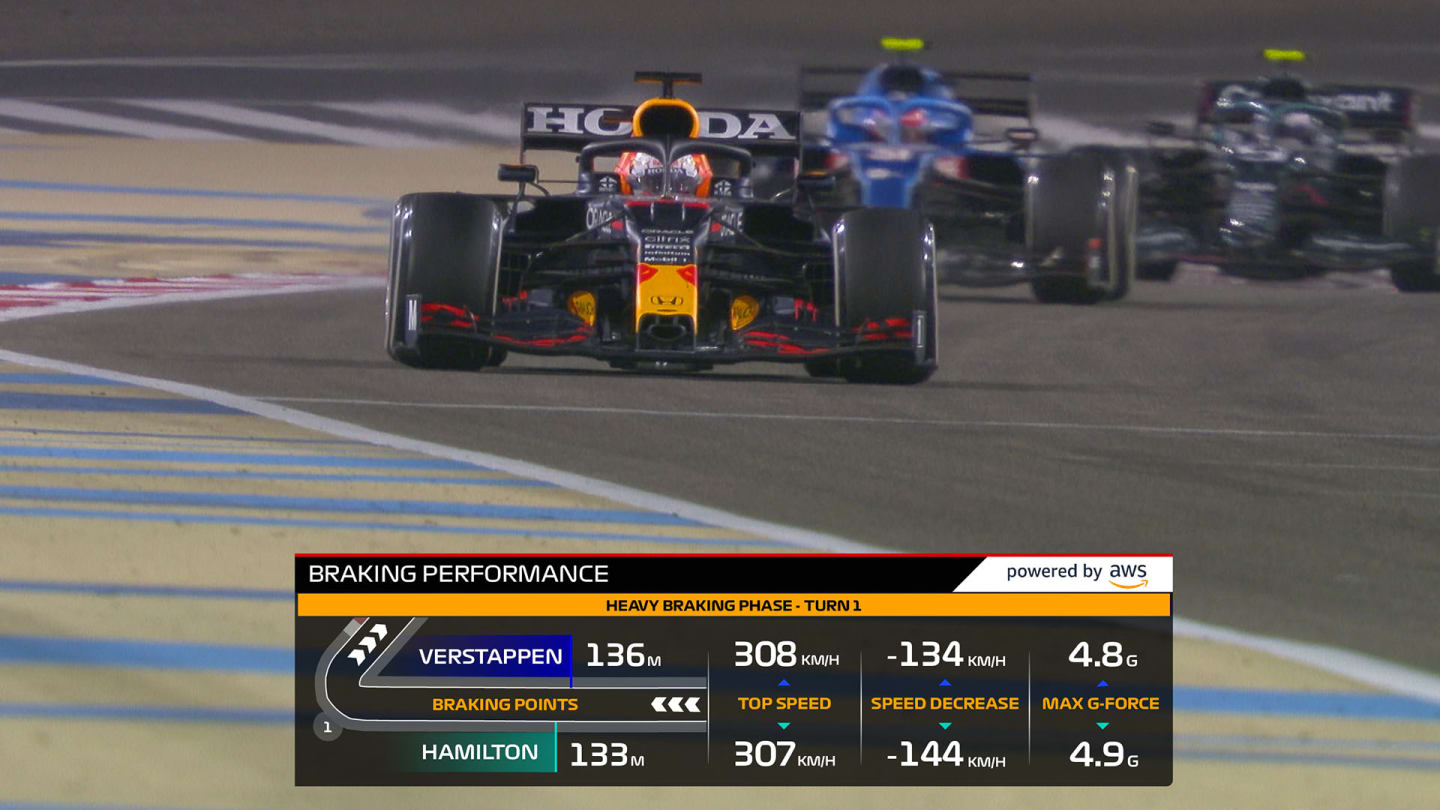
Earlier this week Formula 1 and AWS announced a raft of six new F1 Insights Powered by AWS graphics set to debut throughout the 2021 F1 season, designed to give fans an even greater insight into the action happening on track. In this special blog, former Ferrari and Williams engineer and Formula 1’s Director of Data Systems Rob Smedley explains how the first of these new insights – which looks at braking performance – will work, and what it will tell us.
A key point of intrigue for the fans, both casual and avid, is how hard a Formula 1 car can brake. Fans are often surprised to find that an F1 car can decelerate at more than 5g, that means under peak braking, the driver’s body is moved forward with a force of five times that of the unaccelerated state.
Formula 1 cars carry so much downforce that at the start of braking, they can generate huge amounts of load that push them into the ground and help them to stop in an incredibly short space of time.
This part of the corner, that is known to the engineers as the ‘braking phase,’ is a key area where the driver can extract performance from the car. After this incredibly violent braking manoeuvre from more than 300km/h, the driver then must navigate the turning and the mid-corner precisely before they get to the exit phase of the corner and accelerate out and down the straight, only to have to do it all again at the next corner.
We have recently been working on this latest F1 Insight to tease out the important aspects of the braking phase and bring this to the fan in a neatly packaged, data-driven insight – which is being used for the first time at this weekend's Emilia Romagna Grand Prix at Imola.
The New Insight – Braking Performance
A conundrum we are often faced with as trackside engineers is how to extract the most performance from the car for every phase of the corner. As with everything in life, it’s a compromise. If you brake too hard, or too late, you will more often than not miss the apex and not be able to carry enough mid-corner speed where there will be a bigger and overall net loss despite the ‘better’ braking phase.
On the contrary, if you brake too early, and with too little deceleration, you will lose time to your adversaries in this braking phase. Therefore, the drivers, with the assistance of their engineering teams, need to find the best compromise.
The first aspect we need to consider when we are looking at the braking phase is to ascertain if the lap was good or not. We do this by taking only the best sector for the driver in question that contains the corner under analysis. By doing this, we can be sure that we will have captured the best corner that the driver was able to extract in terms of car performance.
TECH TUESDAY: Why Red Bull's ingenious rear suspension is helping give them the edge in 2021
We are then interested in how the driver extracts performance during the straight-line braking phase. This F1 Insight, unlike our Corner Analysis insight, does not take into account the phase of lateral acceleration, or in layman’s terms, when the driver has steered into, and subsequently out of, a corner.
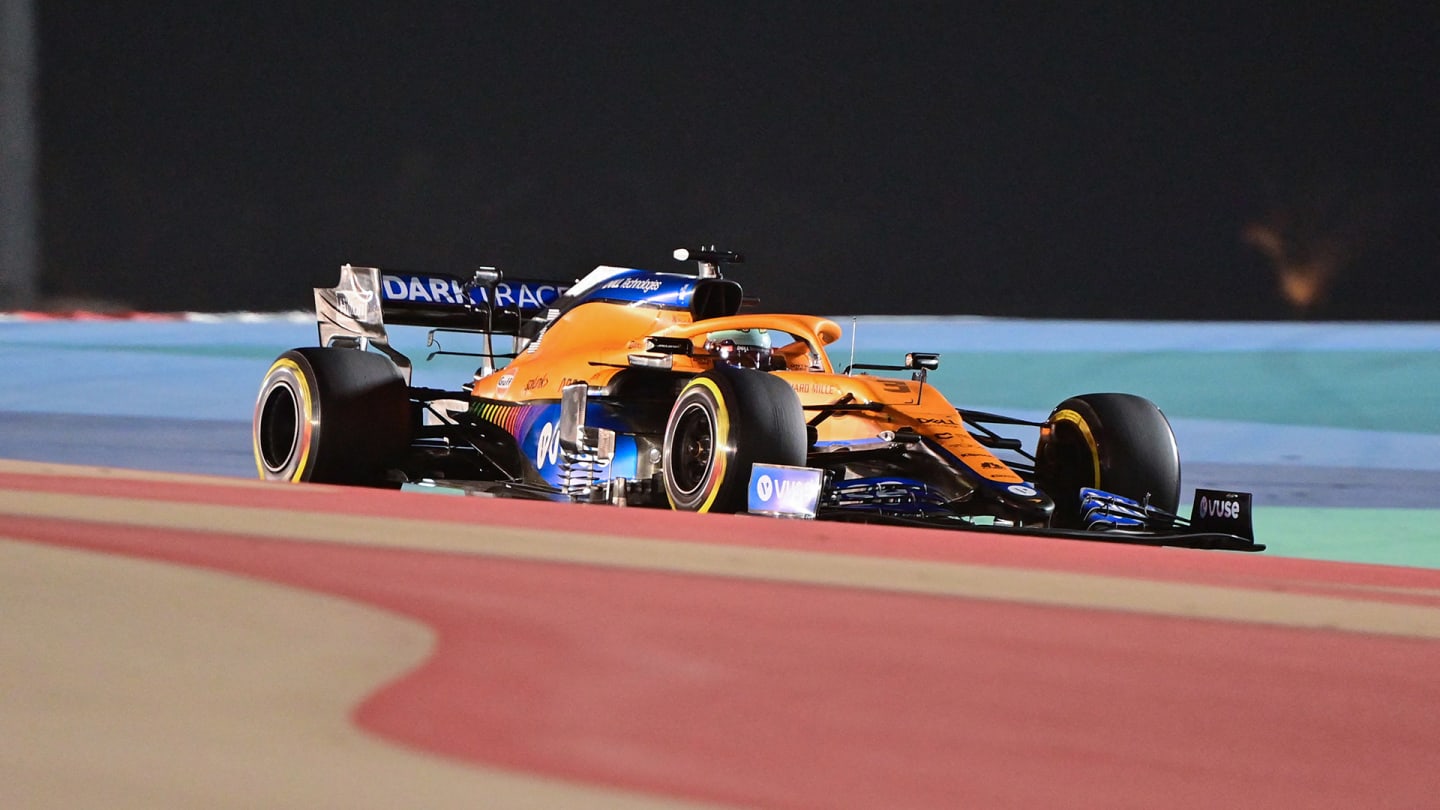
Daniel Ricciardo is renowned as being late on the brakes – but will the graphics reveal otherwise?
This new insight is all about how well the driver can decelerate in that initial straight-line phase of braking. The main data parameters that we are interested in when we want to compare one driver to his adversary is the point at which the car brakes, and also how hard the driver is able to brake. Let’s take each in turn.
If we take a point on the track where the driver brakes, this is directly proportional to performance. Assuming that the driver can stop the car down to a similar mid-corner speed as his adversary at the same position on the track, then the later he brakes the more lap time he will extract from the car from this phase, and subsequently, overall.
The second aspect from the initiation of braking, is how hard the driver can brake during this phase. This we can measure in two ways: the first is the peak and average deceleration, and the second is the braking power, which is measured in kilowatts. The higher the power, the faster the car is decelerating in a straight line.
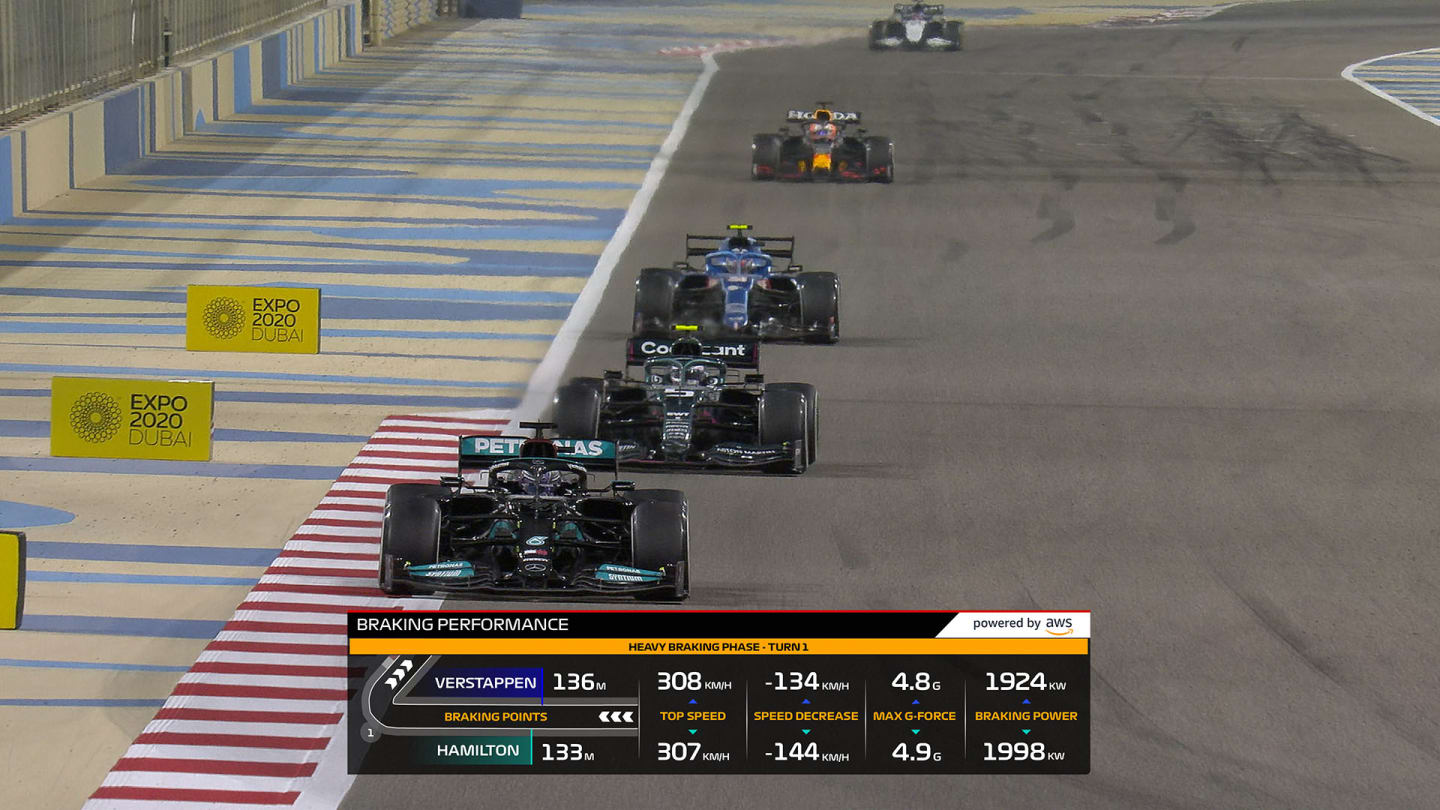
The new graphics should provide a greater insight for the fans at home
Let’s use a simple example for the braking power. If two identical cars brake at exactly the same point on the track but one brakes with more power, then over a fixed distance of 50 metres, the first car which has braked with more power, will arrive at the end of the 50m distance with less speed. Let’s flip this on its head and say that both cars need to arrive at the apex of the corner with the same minimum speed. The car that brakes with more power, therefore, can brake later and gain time on the car that brakes with less power.
To extract performance in the straight-line braking phase the driver (as long as he has a car that permits him to do so) can gain time on his adversary by both braking later and harder, or with more power. In the next section we will look more closely at how we have derived the mathematical models and based them on the data in order to bring this braking phase to life for the fan.
How the modelling works
The modelling first focusses on having the most reliable calculation of the initial braking point of the car on the track. In order to do that we use a mixture of car telemetry and timing data feed from the circuit timing system.
We then have two sources for identifying the car positioning on track: the circuit timing loops and car transponder systems, and the telemetry from each of the cars.
The circuit timing system is made of various sensors around the track that detect the car passing by. The data packets for each car consist of a car’s unique identification and time of day that the car in question passed the timing loop.
From the car telemetry we can derive the information about what distance the car has travelled from the start-finish line to any point on the track.
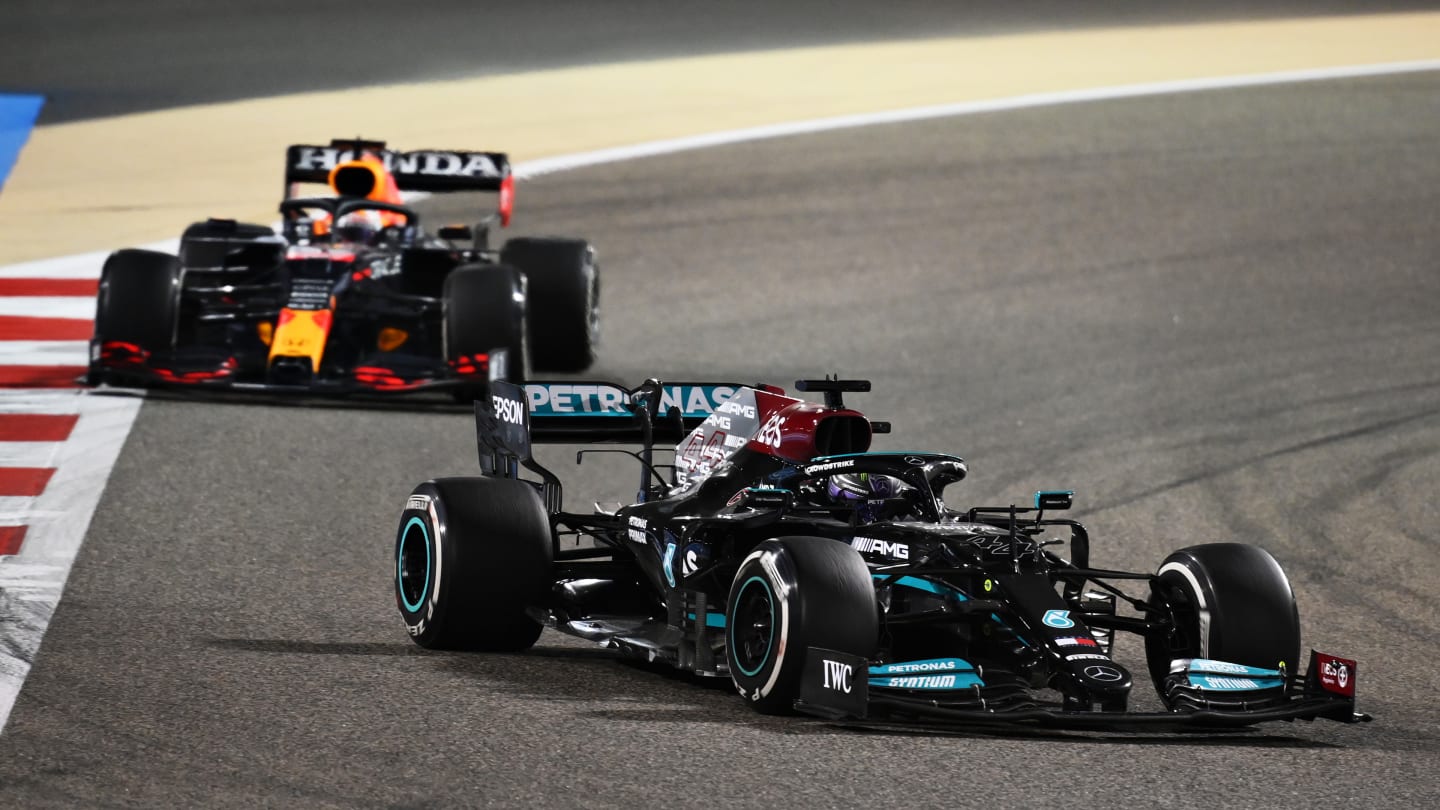
Will the data highlight any differences between championship rivals Hamilton and Verstappen?
By fusing both sources, this allows us to position the car in the track. The timing system is placed in discrete positions around the track (of the order of 25 to 35 positions) and it is very precise, within centimetres.
The telemetry that integrates the wheel speeds to calculate the speed and the distance (with an acquisition frequency of 20Hz) is available continuously at each time sample around the track, but will offer an instantaneous lower accuracy than the timing system data.
WATCH: Ride onboard with Pierre Gasly to see how to nail a lap of Imola
By correcting the telemetry-reconstructed distance by the data received by the timing system, we are able to merge the positives of the two systems. Once we have derived the “distance channel” that is referenced to the track and therefore common for all cars, then we are able to access the actual braking point with the required precision.
We are then able to also calculate the important parameters as described in the section above – average and maximum deceleration in the first 50 metres of the braking, for example, or the power dissipated by the braking in order to decelerate the cars, as you can see in the graphic below.

Summary
This new addition to our suite of F1 Insights powered by AWS should give us another data-driven insight into how the cars and drivers are performing. Undoubtedly, a significant difference between a road car and a Formula 1 car is how hard a Formula 1 car can brake and the incredibly short stopping distances that the driver goes through hundreds of times during every single Grand Prix.
We think that this is a great insight for fans, broadcasters, teams, and more into demonstrating just how difficult this skill is for the modern-day Grand Prix driver.
Share
YOU MIGHT ALSO LIKE
News Formula 2 racer Victor Martins joins Williams Driver Academy
Podcast F1 NATION: Tsunoda's Red Bull chance and the McLaren intra-team battle – it's our Japanese GP preview
Feature TREMAYNE: Japanese drivers have a rich history in F1 – but can Yuki Tsunoda grab his chance and be the best of them all?

Video WATCH: Lawson out, Tsunoda in – Laura Winter and Lawrence Barretto discuss Red Bull’s driver call
